Interior’s Contributions to America
Next Interior is using publicly available data to shed light on where and how the Department of the Interior serves the Nation

Editor’s note—Today’s newsletter is coauthored by Next Interior’s ED, Jacob Malcom, and Beth Ross, Next Interior’s Statistical Advisor, the authors of the tools described here. Like yesterday’s newsletter, today’s is on the long side. Good news: you don’t need to read the whole thing to get the point, but you can read it in full if you’d like! Want to learn more? We're doing a short webinar on 18 November, 4:00-4:30 pm Eastern; sign up here.
What to know
- Interior’s Contributions (beta) is a web app for desktop or tablet (no mobile yet) and library of fact sheets providing basic information and statistics relevant to the US Department of the Interior—lands and waters, science, and serving Tribes.
- Users can select a state or congressional district of interest from the left sidebar to filter and summarize the underlying data.
- The map shows key places for a user’s selection and the right sidebar shows statistics about Interior-managed lands, economic contributions from national parks, science offices and centers, and offices and schools serving Tribes.
- Short fact sheets for each state and congressional district, which can be shared as pdfs or printed to hand out, can be downloaded from the button at the bottom of the right sidebar.
- There are limitations to the data, which are described in detail below and summarized here.
- A draft “roadmap” identifies refinements and potential additions for future versions. Collaborators or contributors can express interest in involvement here.
Acadia National Park in Maine and Canaan Valley National Wildlife Refuge in West Virginia. The US Geological Survey’s Upper Midwest Water Science Center in Minnesota’s 8th Congressional District, or CD. The Bureau of Indian Education’s (and Cherokee Nation’s) Sequoya High School in Oklahoma’s 2nd CD. The Glen Canyon Dam and the National Recreation Area upstream in Arizona’s 9th. The Bureau of Land Management’s King Range National Conservation Area in the California 2nd CD. The Bureau of Ocean Energy Management’s office in Anchorage, Alaska (At-Large CD).
This is just a tiny sampling of the places where the US Department of the Interior contributes to America’s well-being every single day. For our parks, wildlife, and public lands. Water, energy, and other resources. For science and knowledge about our resources. And to fulfill Trust and Treaty obligations to Native Americans, Alaska Natives, and Native Hawaiians, as well as special obligations to the territories.
But here’s the thing: the Department is so big and serves so many people and needs and interests, it’s hard to get a handle on what it does in any given area. We can often use an overview of how Interior contributes to our well-being, safety, and prosperity both locally and across America. What if you’re a member of Congress who wants to understand Interior’s work as you consider funding questions? It’s tough to get answers, at least in a timely fashion. An advocate who wants to put their issue of interest into context of Interior’s work? Tough to get answers. Someone who is just curious…you get the point.
To further our mission to build a strong Interior for current and future generations, Next Interior started pulling together open data into a tool so that anyone—everyone—can see where and how the US Department of the Interior serves the American people.
Interior’s Contributions (beta) is a web app (for desktops and tablets) and library of fact sheets providing basic information and statistics relevant to the US Department of the Interior, available by state and congressional district (CD). This includes information about the lands managed by Interior and its bureaus; the economic contributions from our national parks and public lands (as available); and key offices and resources that people depend on, such as dams and Bureau of Indian Education schools. Users can select states or CDs to get tailored statistics, click on map features to get basic information about features, and download brief fact sheets for ready printing and sharing.
Here, we first give some guidance on usage, then illustrate a few examples drawn from the app. Next, we discuss the roadmap for further development and offer a call for collaborators. Last, for those who like to get into the details, we describe what we did to make the tools—the methods—and discuss the limitations of the tools at greater length.
Using the app and fact sheets
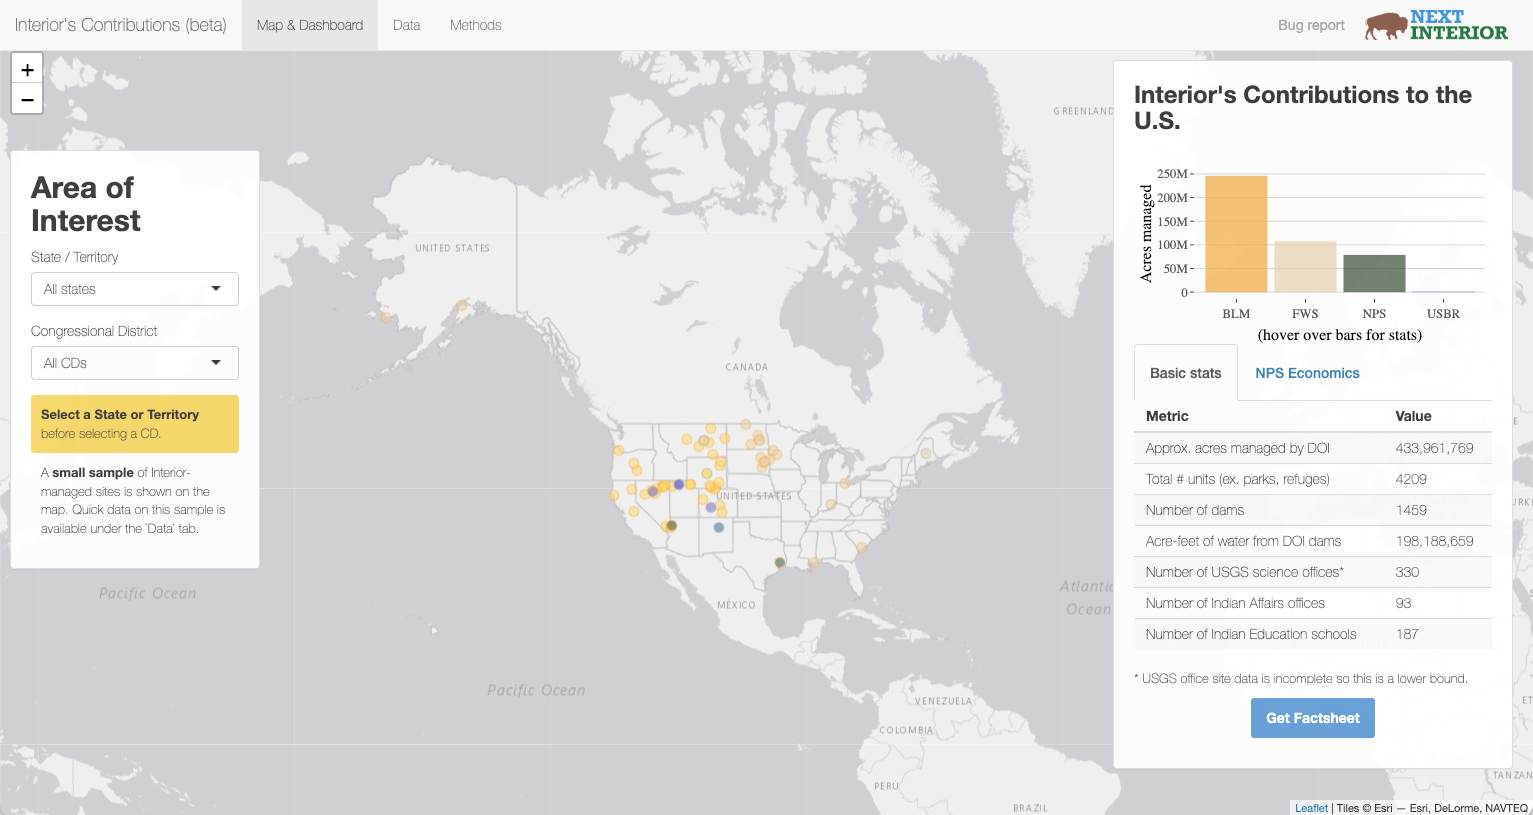
Interior's Contributions (beta), shows key statistics and visualizations about the lands, offices, and services of Interior at the scale selected in the left sidebar, labeled “Area of Interest.” Here’s a quick walk-through, starting at the national level:
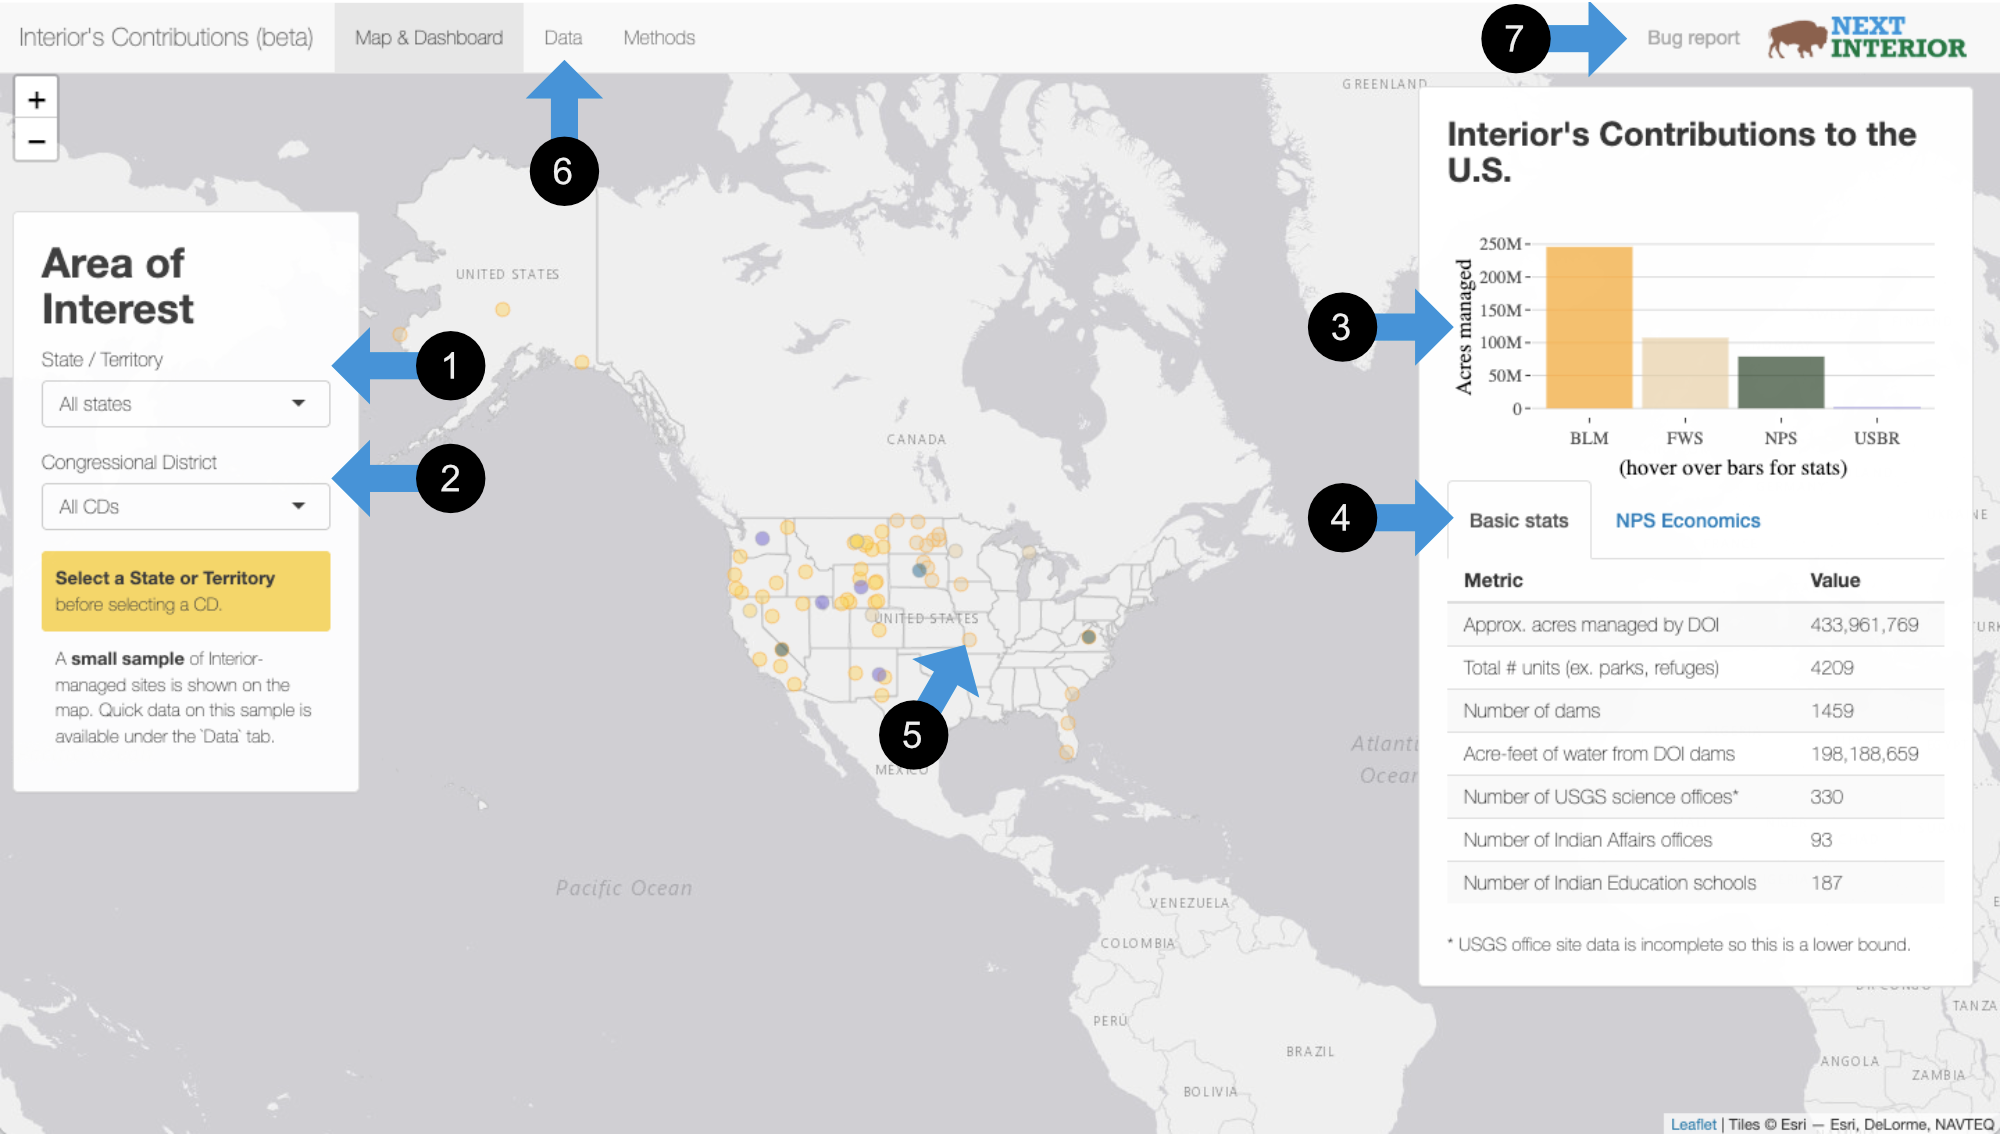
- Select a state or territory of interest to filter the data at the state level. More on that in a moment. (Note that Alaska selections will take a few seconds to load…a lot going on up there!)
- You may select a CD of interest to see detailed maps of Interior's lands and the locations of key offices. More on that in a moment.
- The right sidebar starts with a simple bar graph of the area (acres) managed by Interior bureaus.
- Below the bar graph is (a) table of basic stats and (b) NPS economic statistics in the second tab. Click the tab name to select either.
- The national map shows a sample of Interior-managed places from across the country. Click on a circle to get a brief label.
- If you want a bit more information, you may click on the Data tab at the top navbar.
- If you find a bug—something doesn’t seem right or the app shuts down—then please help us out by submitting a bug report.
Once you’ve selected a state, you’ll get a view like this one for Arizona:
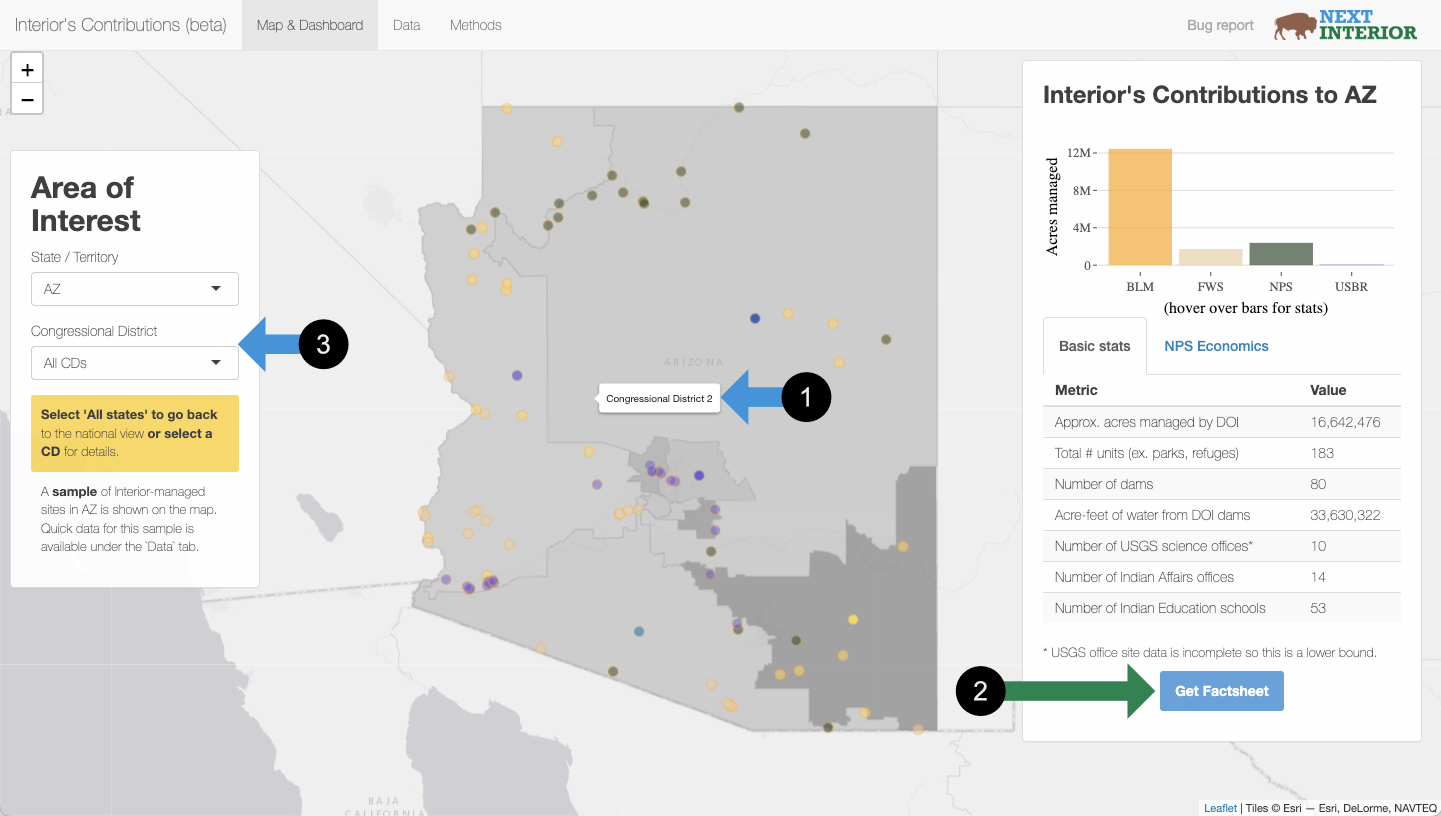
- If you have selected a state then the map will show CD boundaries; hover over an area to show the CD name to aid in the selection.
- If you want a fact sheet, click the button at the bottom of the right sidebar and a new tab will open with the PDF.
- You may select a CD to further filter the view and data.
The other elements remain the same. Once you’ve selected a CD, you’ll get a view like this:
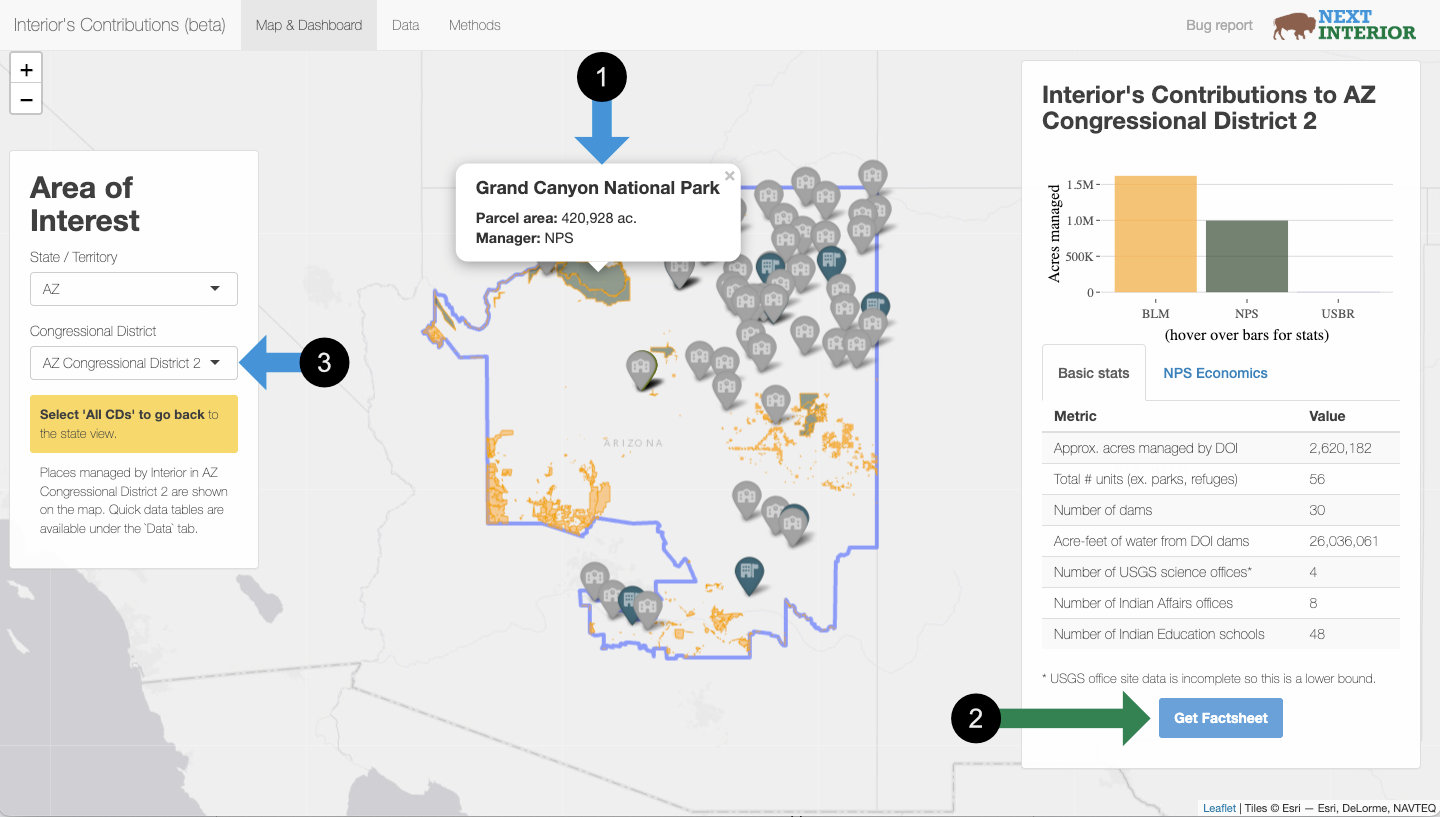
- You can click on a polygon or marker to get a short label for what is represented.
- As with the state view, if you want a fact sheet, click the button at the bottom of the right sidebar and a new tab will open with the PDF.
- To go to another view, first select 'All CDs' and then change CD or change the state selection.
- If there are no CDs listed for a state, select a new state/territory, which should refresh the list and then you can return to your chosen state's list.
- A few CDs have spatial data issues that prevent the map from rendering; if that happens, you can still see the stats, but please choose a different CD or state and the map should return.
There are a variety of other details throughout the app…start exploring, but note the limitations!
Limitations
This is a beta app and there are some limitations based on the data plus unresolved glitches. Summarizing the discussion in What We Did, users need to recognize these known limits:
- The boundary data for CDs is relatively low resolution, meaning that some boundaries don't align perfectly, which may lead to misestimates; users are strongly encouraged to use the term “estimated” to acknowledge this.
- The economic contributions statistics (a) makes simplifying assumptions that are imperfect but can hopefully be useful; and (b) is incomplete for all of Interior because it is from a subset of Interior's bureaus—NPS for the app and NPS + BLM in the fact sheets; as above, users are strongly encouraged to use the term “estimated” to acknowledge this.
- Some dam coordinates from the National Inventory of Dams have been found to be incorrect; users should exercise caution and check locations before making any strong statements.
- The USGS offices data are known to be incomplete; users are strongly encouraged to use the term “at least” a number of USGS offices to acknowledge this.
- The BIA and BIE data appear to be pretty good, just note that they don’t really illustrate outcomes, such as student achievement from BIE schools…a future iteration.
Citation
If you use data or stats from this app, please cite as:
Malcom, J. and Ross, B. 2025. Interior's Contributions (beta) web app. Next Interior. Available at: https://nextinterior.shinyapps.io/InteriorsContributions/
Key examples
Users can explore the data at their leisure and given their interests, but here we provide a few examples and how we contextualize the information from the tools.
Utah
Federal lands, in particular those managed by Interior, are an essential part of Utah’s landscapes and society. Overall, 47% of the state (25+ million acres) is managed by Interior bureaus, including NPS, FWS, and BLM. Interior’s lands range from about 13.8% (399,908 acres) of CD-04 to about 57.7% (14,785,252 acres) of CD-02. Interior’s lands are particularly relevant in the political landscape; Senator Mike Lee of Utah has been a vocal opponent of public lands in the state and beyond.
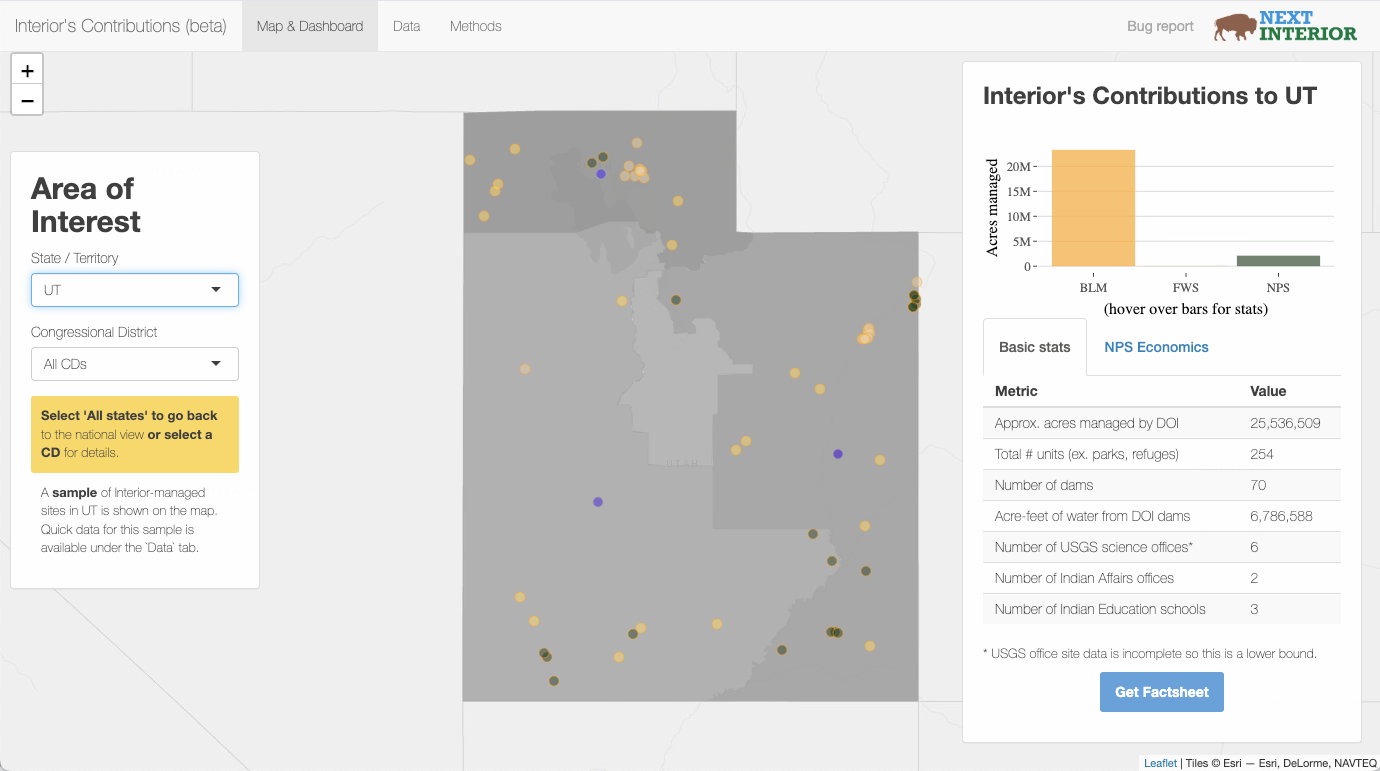
But those lands are critical to Utah’s economy: BLM and NPS lands in the state generate over $10 billion in economic output and support over 65,000 jobs annually. Where does that come from? For one thing, the NPS units in Utah had over 16 million visits in 2024—it’s no surprise why the state is happy to chip in to keep national parks open during the current shutdown. For comparison to NPS, recreation on BLM lands in Utah contributed about $2 billion of economic output in 2023; and for comparison within BLM, grazing contributed an estimated $141 million and oil and gas about $5 billion to the state. For overall context, the nominal GDP for Utah in 2024 was $301 billion.
(Importantly, the economic contributions estimates in the app do not include the economic contributions of water managed by Interior. Critical for a Western state, Interior manages 70 dams in Utah with a combined reservoir capacity of 6.7 million acre-feet of water, enough for approximately 17 billion (yes, billion!) households a day. This economic value is surely gigantic.)
There are at least six USGS offices or science centers in the state that contribute to science and decision making in the Southwest. Further work is needed to refine those numbers and help translate the places into how people and lands benefit from this science, data, and knowledge.
Last, seven federally recognized Tribes, including several bands, are found within Utah’s boundaries. There are 2 BIA offices and 3 BIE schools in Utah supporting the work to fulfill Trust and Treaty obligations to the Tribes in the state.
Arizona
Arizona offers a variety of examples of Interior’s work for the country. First, Interior manages over 16 million acres of land in Arizona, or 22.8% of the state’s lands. Among the state’s congressional districts, CD 3 has the smallest land holdings with 187 acres (0.1% of the CD) and CD 9 has the largest land holdings with over 9.7 million acres (65% of the CD). Four bureaus, BLM, USBR, NPS, and FWS, all have land holdings within Arizona. Some of them are on the border and being heavily impacted by border wall activities that undercuts the mission of the Department (disclosure: J. Malcom worked at San Bernardino NWR on the border for nearly a decade and so holds those borderlands dear).
The national park units and BLM lands in Arizona contributed over $2.7 billion annually to economic output in Arizona. This does not include economic contributions from other bureaus like USBR—likely enormous—or FWS—likely not huge, but not zero. For context, real GDP for Arizona was $433 billion in 2024.
Water is critical in hot and arid states like Arizona, so Interior plays a crucial role through water provision. The NID shows there are 80 dams managed by Interior in Arizona, and the associated reservoirs have a capacity of over 33 million acre-feet of water. Based on average household use, that’s roughly 84 billion (again, yes, billion!) households per day.
Of course, lands and waters aren’t all of Interior’s work. For example, there are at least ten USGS offices and science centers in the state that provide actionable science to help inform resource management of Southwest ecosystems and communities.
There are 22 federally recognized Tribes within Arizona’s borders that are served by Interior, most prominently the Navajo Nation, the largest federally recognized tribe in the US, in the northeastern part of the state. Because of this, there are 14 BIA offices and 53 BIE schools across the state. We would love future iterations of Interior’s Contributions to add data that can meet those Tribes’ needs and interests, in particular focusing on outcomes for people and places.
West Virginia
In contrast to Western states, the lands and waters managed in the East are proportionally smaller. West Virginia—which, like Utah, is paying to keep its national parks operating during the shutdown, albeit with reduced services—offers a good illustration. As a member of the Senate Committee on Environment and Public Works, West Virginia’s Sen. Shelley Moore Capito has a significant role in shaping Interior’s work. Here, we’ll just focus on the lands: Interior manages an estimated 85,546 acres in West Virginia, which is just 0.6% of the state’s area. Those lands are managed by FWS (such as Canaan Valley National Wildlife Refuge) and NPS (Harpers Ferry NHP in WV-02 and New River Gorge NPP in WV-01). The NPS units in the state contributed over $44 million in economic output and supported an estimated 332 jobs in 2024; adding in the economic contributions from FWS lands would only increase the amount of Interior’s impact.
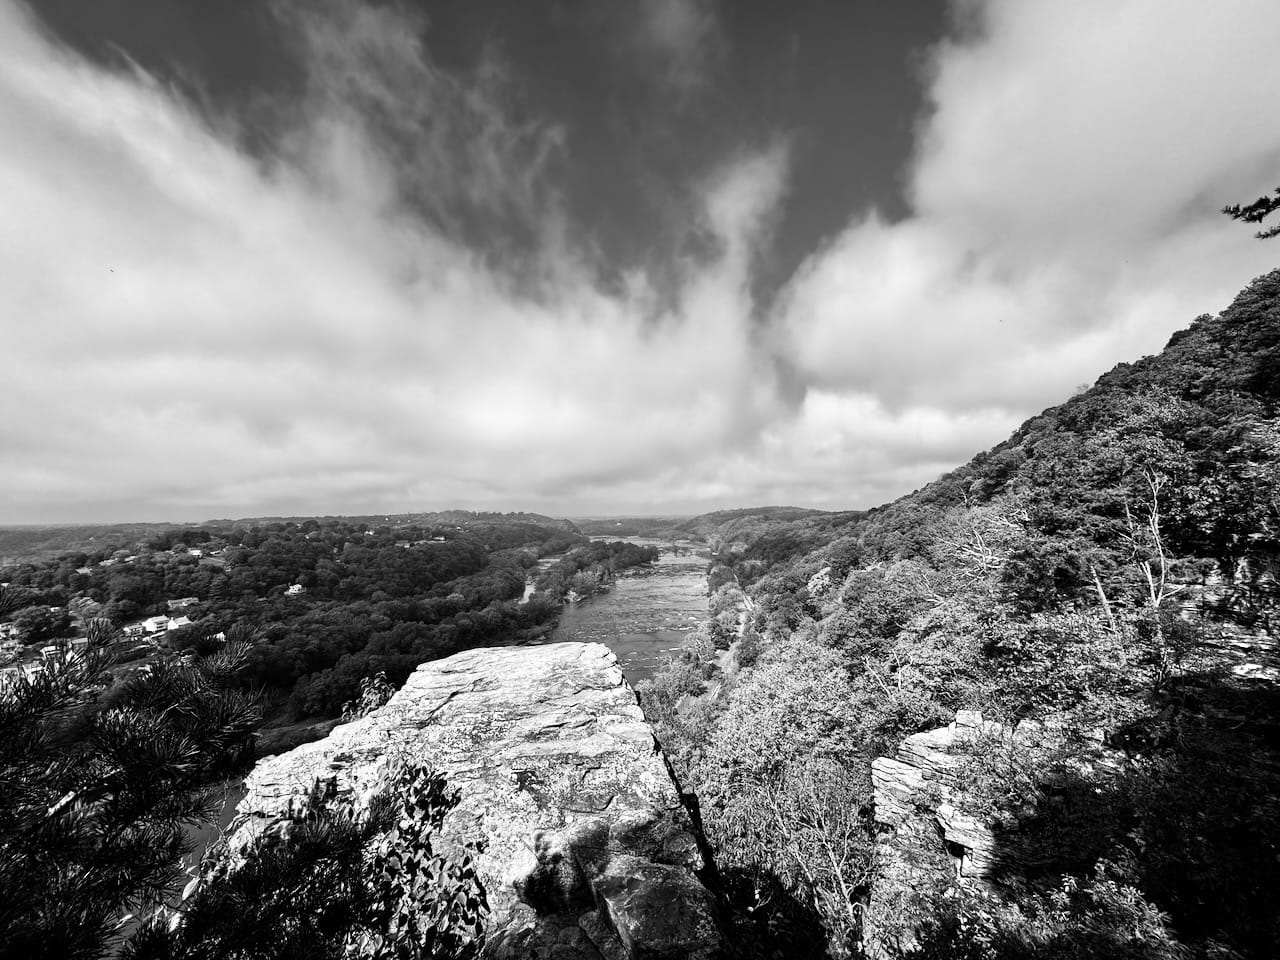
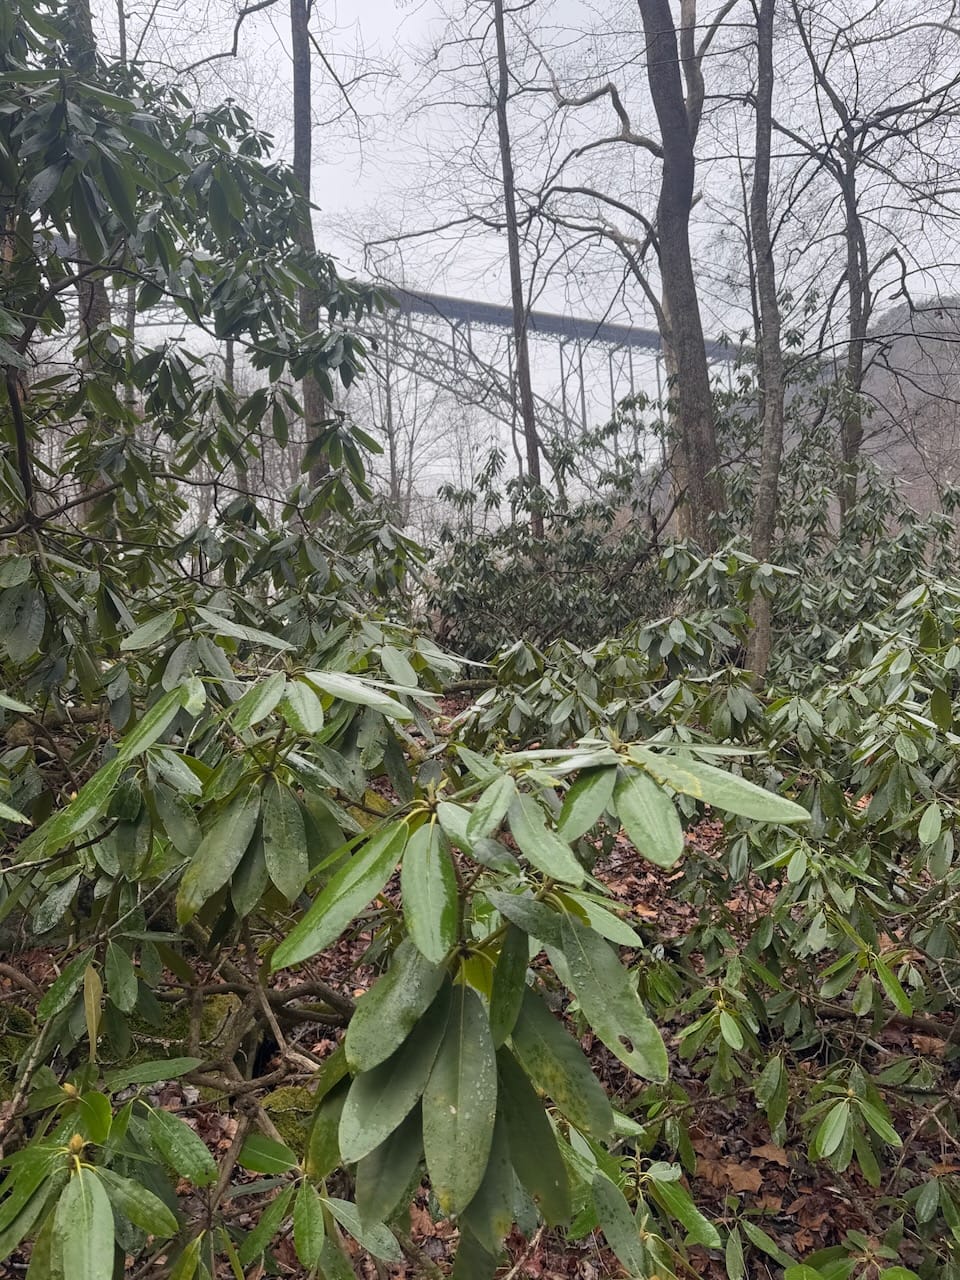
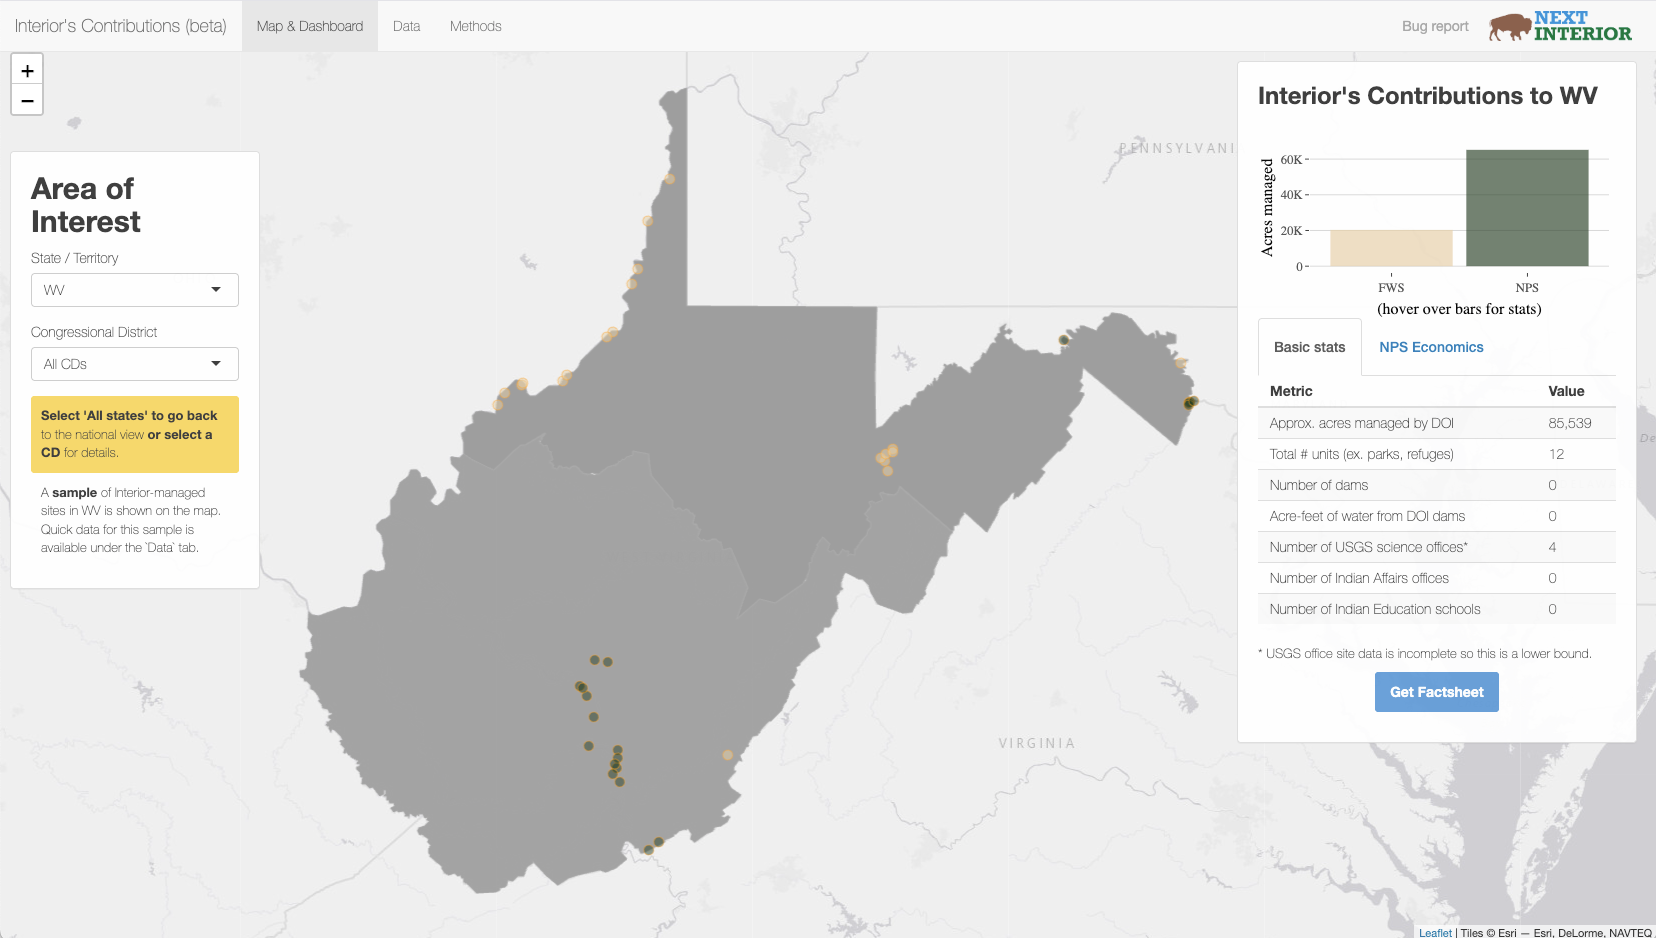
Looking over West Virginia at Harpers Ferry NHP (left / B+W); looking up at the New River Gorge Bridge from rhododendrons in the New River Gorge National Park and Preserve (middle); and the Interior's Contributions overview of West Virginia (right / map). CC-BY-SA Next Interior.
Alaska
Last but not least, it is worth noting the particularly large influence of Interior in our largest state, Alaska, and the influence of Alaska on Interior, with Senator Murkowski’s position on Interior’s appropriations subcommittee and attention on Alaska in the current administration. Nearly half the state (47.5%) is managed by three Interior bureaus (FWS, BLM, NPS), totaling 201+ million acres. Economic output out of NPS and BLM combined was an estimated $3.9 billion annually (real GDP for Alaska in 2024 was $54.9 billion total). Those bureaus also support 18,000+ jobs; in a state where non-farm payroll is in the 300,000s, that’s substantial.
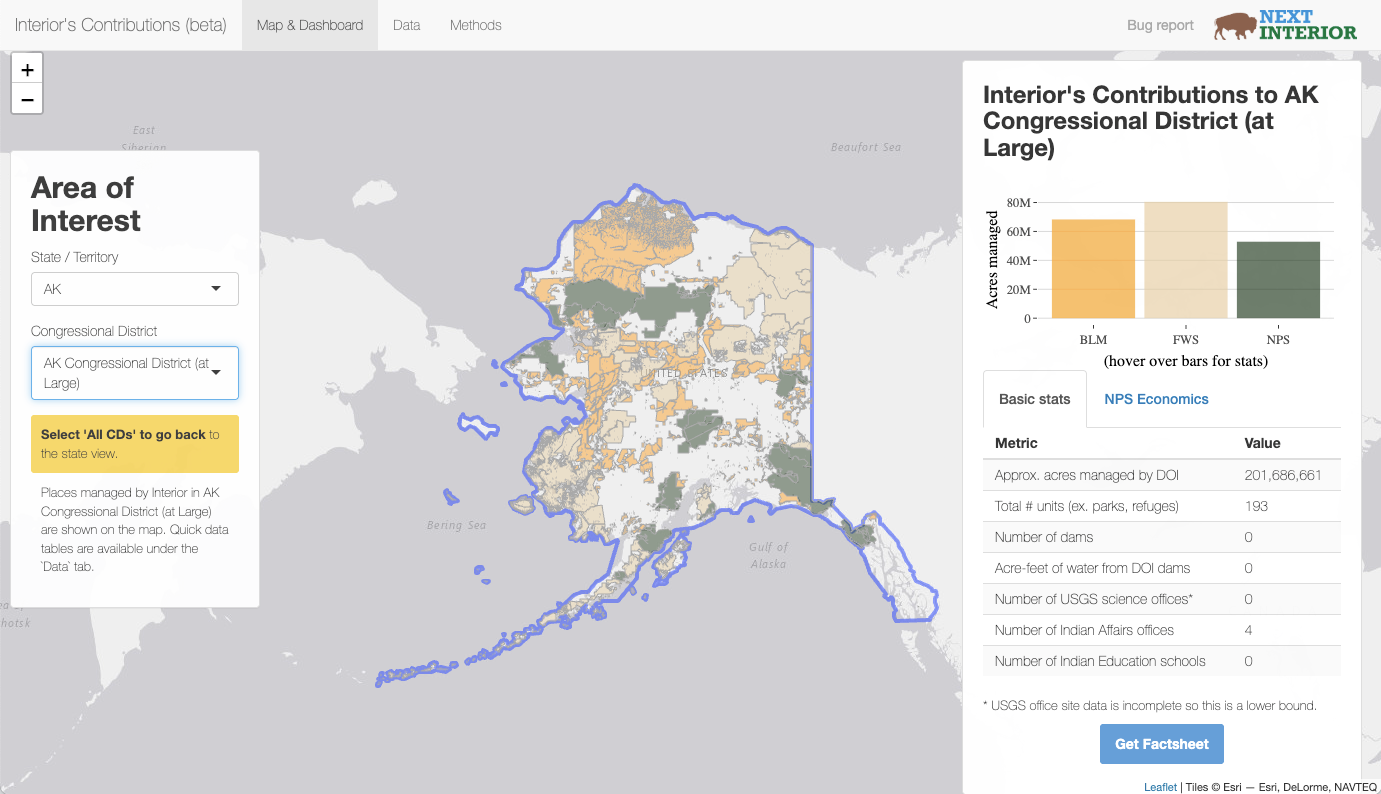
Alaska is also home to four BIA offices serving Alaskan Native Tribes and Corporations, of which there are dozens that are federally recognized. In addition, the Office of Subsistence Management at Interior serves many thousands of rural subsistence users—most of whom are Alaska Natives—across the state.
And there are three USGS Science Centers in AK: Alaska Science Center, Volcano Science Center, Climate Adaptation Science Center. Importantly—and consistent with the caveats discussed elsewhere—this example shows how we need better data for USGS: these Science Centers are not listed in the app or on the fact sheet for Alaska. We can make progress in improving the data with collaboration!
Next steps for Interior’s Contributions, and call for collaborators
Interior’s Contributions is a beta app and resource; there’s more we’d like to do to move it to full production value. Some are user interface / user experience updates like a mobile version, a cleaner startup overlay for new users, or the ability to click on states and CDs on the map rather than drop-downs. We plan to hold listening sessions or other means to propose enhancements in coming months to hear what others would find useful. For now, here are a few things on our radar:
- Reviewing the PAD-US overlap analyses and adding back in true overlaps that were inadvertently filtered out, such as small parcels. This includes small NPS units, which will help us represent contributions across the spectrum of NPS sites.
- Updating and cleaning up the list of US Geological Survey centers and sites across the US, including the Cooperative Research Units and others. We believe those data exist but where and how to access them is unclear.
- Incorporating the General Service’s Administration’s data on federal agency real property, pulling out Interior’s data.
- As possible, incorporating the Office of Personnel Management’s data on Interior staffing across the country. Those data may only be available at state level, but we need to dive in to find out more.
- Spatially explicit data on energy production and transmission across Interior’s estate, on-shore and off-shore.
- Discussions with Tribes and Indigenous groups about what sort of data would be helpful to them and meet their needs.
- Incorporate data on the OSMRE’s Abandoned Mine Lands program and the places and communities it benefits.
- Any relevant data on the OCS, key to BOEM and BSEE’s work.
- What are opportunities to overlay other data layers, maybe with switches, such as population, ecosystem, or other data? Can sources like FWS’s ECOS be of use?
- Other topics that are of interest to you or your community!
So, are you interested in collaborating or contributing to Interior’s Contributions? If so, please fill out this form to throw your hat in the ring:
What we did (aka Methods)
Data provide critical context for discussions and decisions that affect people’s lives, society, and more. Given the resurgence of attacks on federal institutions, science, public lands and waters, and more that is central to Interior’s mission, we sought to gather data about Interior’s resources and make it accessible to provide that context. Each domain of the Department’s work that is incorporated in Interior’s Contributions requires different data and different considerations.
Public lands: PAD-US
Interior may be best-known for its role in managing about ⅕ the US land base: national park units, national wildlife refuges, and the public lands system managed by the Bureau of Land Management (BLM). But where are those lands? To find out, we combined the Protected Areas Database of the U.S. (PAD-US) filtered for Interior’s lands with Census Bureau-provided state and CD data (from the tigris package of R). The specific PAD-US data was pre-processed to remove overlapping areas, or “flatten” the data to a single layer in any given location. So if a tract is managed by BLM for multiple uses but contains an area within it having greater protections (e.g., a wilderness area), then the data is sliced to include the higher level of protection and not double-count the area.
Importantly, the spatial resolution of the Census data is considerably rougher than the PAD-US data. As a result, the spatial overlap analysis introduces artificial inconsistencies along state or CD boundaries. For example, there were many, usually tiny, overlaps that don’t exist, such as New Mexico BLM’s land showing up in Colorado. We explored the small overlap data at length and created filters to remove elements where there was a mismatch between BLM state office origin. Given the very large number of tiny overlap areas along the edges of CDs and states, which in every case we investigated were false, we also filtered out any overlaps less than 5 acres. This had negligible effect on the total area of overlap, but may have produced some false negatives. Future work to refine the filters would be beneficial for more precise estimates. (There is also probably an opportunity for the TIGER polygon data for CDs and states from Census to be refined to, e.g., match high-resolution state boundary data rather than just approximate it, but that’s for another day.)
Economic contributions
The Department’s work contributes to national, regional, and local economies through economic and non-economic matters. Parks and refuges drive visitation in which people spend on travel, food, goods, and services. Public lands support the production of energy, minerals, and agricultural production. Dams and waterworks managed by Reclamation support economic activity through electricity generation, municipal water, agricultural waters, and more.
For the beta release of the Interior’s Contributions app, we focused on the economic contributions data from National Park Service units. For any selected spatial unit (that is, state or CD), the app and fact sheets provide the sum of contributions to economic activity, park visitation, the number of jobs supported, and the visitor spending estimates. Some park units extend across state and CD boundaries, so we had to decide how to treat those cases. The NPS reports the split of economic metrics of interstate park units in their analyses, weighting economic contributions by visitation numbers. We found that estimates of economic contributions by state based on proportional area overlap were very similar to NPS’s visitation-based estimates. Therefore, because we are not aware of CD-level visitation estimates that would allow us to apply NPS’s state-level method, we used the proportion of CD overlap for multi-CD parks to weight the economic metric estimates by CD. As described elsewhere, using the term “estimate” is good practice to reflect the inherent uncertainty.
Before the launch of the beta, we were also able to incorporate BLM’s economic contributions estimates into the fact sheets. Unlike NPS economic data, those data are aggregated at the state office level and therefore include pooling of estimates for some states, like New Mexico, Texas, Oklahoma, and Kansas. While we know there is extensive spatial variation of where economic activity occurs within states—consider variation in where recreation occurs or where there are oil and gas operations—we made the simplifying assumption that the relevant economic contributions estimates were distributed evenly across the “state.” To estimate an economic metric for a state or CD that is a subset of what is provided by BLM (e.g., a CD within a state or a state within a multistate area), we multiplied the contribution estimate from BLM by the proportion of BLM land within that state or CD relative to the overall unit.
As a result of this approximation approach, users should be aware that estimates may be too high or too low depending on the contextual details. Take Colorado for example. We would expect economic contributions from recreation on BLM lands in the Colorado 4th CD are actually lower than what is shown in the fact sheet—there aren’t quite as many mountains in the CD. In contrast, we might expect the economic contributions in the Colorado 3rd CD to actually be higher than what is shown because there is more recreation out there. Here’s the bottom-line: use the estimates if appropriate, but also use common sense in interpreting them for your audiences!
Dams
Interior’s Bureau of Reclamation (USBR) is responsible for providing water in the West through dams and other waterworks. The U.S. Army Corps of Engineers (USACE) holds the National Inventory of Dams, which we downloaded for mapping. We found 45 different names for the four Interior bureaus that have dams in the database (USBR, USFWS, NPS, and USGS), and created a new variable to homogenize the names to filter.
Note that after deploying the app, we found a number of dams whose coordinates are clearly incorrect, such as Colorado River dams miles east of the Colorado River. Work to carry out corrections is on the roadmap.
Science
Quantifying or qualifying the role of science from Interior in American life is tough. (To be fair, it’s a tough challenge for any science.) The US Geological Survey (USGS) is broadly known as the science bureau of Interior, but there are scientists in every part of the Department. However, other than a high-level Science Advisors Council (disclosure: J. Malcom was previously a member of the Council), there is no centralized way to track and calculate the impact of science across the bureaus. This is a matter that Next Interior hopes to approach in coming months.
To start the ball rolling for representing science and Interior’s Contributions, we downloaded a table of USGS offices and centers, then geocoded the addresses using the tidygeocoder package for R to get the latitude and longitude for laying out markers. These sites are among the sampled points shown on the national- and state-level views of the app’s map, and are shown as green markers on the CD-level map. During review, we recognized the listing of USGS sites from their website is incomplete, such as missing Cooperative Research Units. One of the items on the roadmap is to fill in the missing data to get a better view of where USGS works and enable additional analyses.
One of the reasons to map science centers and other USGS offices was to link research products—like papers, data resources, and more—to places across the country. We download data for approximately 15,000 research products from the bureau and their collaborators using USGS’s Publications Warehouse. Those data include titles, authors, and other fields such as the USGS centers involved in the research. We were able to match thousands of the research products to those mapped USGS sites, but it was highly non-random, because of substantial inconsistencies of the names of sites between the datasets. For that reason, we decided to hold off on including publications in this initial release, but have placed that on the roadmap.
Indian Country
While the entirety of the United States Government has obligations to Native American Tribes, the Department has a principal role in fulfilling those obligations. One way to visualize how that is done is by showing Bureau of Indian Affairs offices and Bureau of Indian Education schools across the country. We retrieved those data from the bureaus’ respective GIS resource pages. The BIA offices and BIE schools are among places sampled at national- and state-level views, and shown as map marker at the CD level.
We will publish this post as a report in the coming weeks, and before then, share the Github repo for the code and the Open Science Foundation repo for the data.
Questions or comments about Interior's Contributions? Get in touch.